Forecast smarter.
Plan with confidence.
Stop relying on spreadsheets and guesswork. Turn historical sales data into accurate, transparent forecasts using the method that actually matches how your business sells.

Built for teams who forecast
The method that matches how your product actually sells
Different products move differently. Pick a calculation model built for the demand pattern in front of you — or let the data guide the choice.

Simple Moving Average
Smooths short-term noise by averaging recent periods evenly.
Stable, consistent demand
Weighted Moving Average
Gives recent sales more influence, so the freshest signal leads.
Fast-moving products
Exponential Smoothing
Weighs the most recent period most, decaying older data smoothly.
Moderate fluctuations
Linear Trend Projection
Extends a consistent upward or downward trajectory forward.
Consistent growth / decline
Seasonal Forecasting
Captures recurring peaks tied to festivals, seasons and events.
Seasonal / festival demandEverything a forecasting workflow actually needs
From raw historical data to a number your team can plan around — with the depth enterprise sales operations need.
Quantity, Revenue, or Both
Forecast units moved, revenue earned, or run both side by side.
18 Business Dimensions
Slice forecasts by region, channel, SKU, customer segment and more.
Custom Periods & Horizons
Set the exact historical window and how far ahead to forecast.
Monthly, Quarterly, Yearly
Roll data up or down to the cadence your team plans around.
Automatic KPIs
Forecast revenue, quantity and growth % calculated for you.
Actual vs Forecast Charts
See how each forecast tracked against what really happened.
Export to Excel, CSV & PDF
Take any forecast wherever your team already works.
Role-Based Access
Separate views and permissions for Sales Users, Managers & Admins.
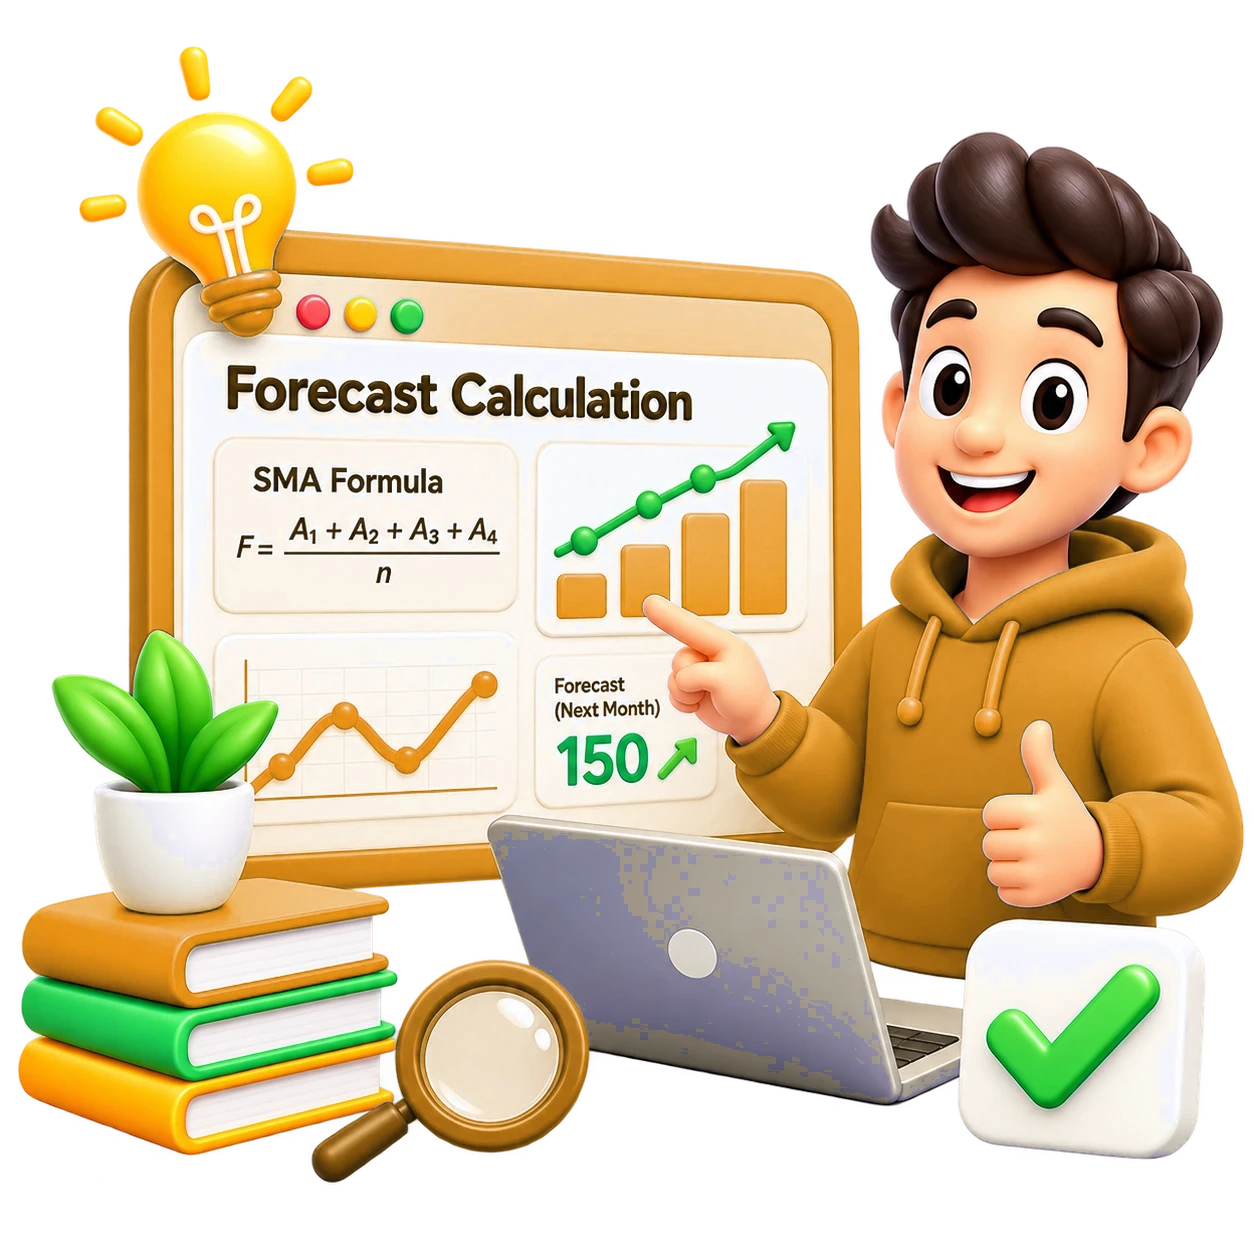
No black box. No guesswork.
Every forecasting method uses clear calculation logic and real-world examples, so your team understands exactly how each number was generated — and can defend it in the room.
Recent months are weighted higher, so a sudden spike in the latest period moves the forecast — exactly the behavior you'd expect to see.
- Full calculation trail for every forecast, on every dimension
- Worked examples using your own historical data
- Nothing hidden behind a model your team can't inspect
Historical sales data to confident decisions
The same four moves, every time — whichever method you choose.
Import historical data
Bring in sales history across the dimensions and periods you care about.
Choose your method
Match the calculation model to how this product actually sells.
Generate the forecast
Get quantity, revenue and growth % — with the logic laid out plainly.
Export & decide
Share to Excel, CSV or PDF and plan with a number the whole team trusts.
One dashboard, every forecast
Quantity, revenue and growth — tracked against 18 dimensions, updated the moment your data is.
Forecast smarter. Plan better.
Grow with confidence.
From historical sales data to a forecast your whole team can stand behind. Bring your numbers — we'll show you all five methods running against them.